LAST week, share prices on Bursa Malaysia did not react to the follow-through rebounds on the Wall Street and Tokyo stock markets.
Instead, the FTSE Bursa Malaysia KLCI (FBM KLCI) responded to the technical pullback on the Hong Kong stock market when it traced out a week-on-week loss of 10.68 points, or 0.57 per cent.
From the perspective of the blue chips’ performance, 16 out of the 30 heavyweight index-linked components consolidated their recent gains with the FBM KLCI closing at 1,862.70 last Friday.
The FBM KLCI continued to stay precariously above its downside support of 1,860 when it hit its intra-week low of 1,860.20 points last Friday.
The FBM KLCI hit its intra-week high of 1,876.17 last Monday before staging a technical pullback to its intra-week low of 1,860.20 last Friday, giving an intra-week trading range of 15.97 points.
The FBM Small Cap Index gained 42.49 points, or 0.24 per cent, to 17,494.78 level while the FBM ACE Market Index added 10.43 points, or 0.16 per cent, to 6,591.76 level last Friday.
Share prices on the New York Stock Exchange staged their follow-through technical rally last week. The Dow Jones Industrial Average closed at its all-time historical closing high of 16,924.28 points last Friday, giving a week-on-week gain of 207.11 points, or 1.24 per cent.
The tech stock-heavy Nasdaq Composite Index moved in tandem with the broader market sentiment last week. The Nasdaq Composite Index closed higher at 4,321.40 points last Friday, giving a week-on-week gain of 78.78 points, or 1.86 per cent.
The Hong Kong stock market paused to consolidate its recent gains last week. The Hang Seng Index closed at 22,951.00 points last Friday, giving a week-on-week loss of 59.14 points, or 0.26 per cent.
The Tokyo stock market continued to rebound further last week. The Nikkei 225 Index closed higher at 15,077.24 points, posting a week-on-week gain of 444.86 points, or 3.04 per cent.
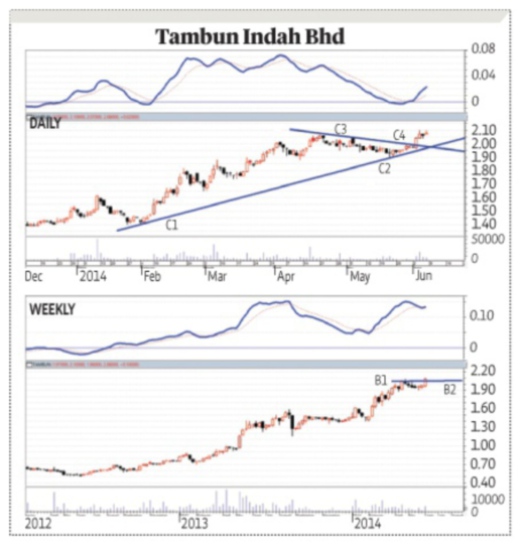
On the home front, Tambun Indah Land Bhd staged a technical rebound last week. Its daily price trend rebounded to close at RM2.08 last Friday.
Following are the readings of some of its technical indicators:
Moving Averages: Tambun’s daily price trend stayed above all its 10-, 20-, 30-, 50-, 100- and 200-day moving averages.
Momentum Index: Its short-term momentum index continued to stay above its neutral reference line last week.
On Balance Volume (OBV): Its short-term OBV stayed above the support of its 10-day moving averages.
Relative Strength Index (RSI): Its 14-day RSI had since stayed above the 50 level. Its technical reading stood at the 68.81 per cent level at the market close last Friday.
Outlook
The FBM KLCI paused to consolidate recent rebound in its bid to dilute the overbought market momentum.
Sixteen out of the 30 heavyweight index-linked components of the FBM KLCI staged technical pullbacks to consolidate recent gains.
Selective second and third liners emerged with some interesting market plays.
Tambun is one of these counters with a week-on-week gain of 10 sen, or 5.05 per cent.
Chartwise, Tambun’s monthly price trend staged a decisive technical breakout of its immediate overhead resistance and continued to stay above its intermediate-term uptrend support last Friday.
Its weekly price trend continued to trend above its intermediate-term overhead support (See Tambun’s weekly price chart — B1:B2) last Friday. Its weekly price trend stayed just above its intermediate-term overhead support.
Tambun’s daily price trend staged a technical breakout of its intermediate-term downtrend (See its daily price trend — C1:C2) and continued to stay above it last Friday.
Its daily, weekly and monthly fast MACDs (moving average convergence divergence) continued to stay above their respective slow MACDs at the market close last Friday.
Its 14-day RSI stood at the 68.81 per cent level last Friday. Its 14-week and 14-month RSI were at the 70.74 and 84.31 per cent levels respectively.
The brief technical breakout of its intermediate-term downtrend (C1:C2) on its daily price chart augurs well for its near-term perspectives.
Tambun’s price trend is now poised to move towards its immediate overhead resistance zone (RM2.10 to RM2.33 levels).
The subject expressed above is based purely on technical analysis and opinions of the writer. It is not a solicitation to buy or sell
Read more: Tambun poised to move towards immediate overhead resistance - Market Watch - New Straits Times http://www.nst.com.my/business/marketwatch/tambun-poised-to-move-towards...


